


| Aircraft Limits | Often referred to as a V-g diagram, shows the structural limits of the airframe. Plots load factor (n) vs Indicated Airspeed. A dynamic envelope is drawn with boundaries for Limit Load and Ultimate Load, the envelope varies with current aircraft configuration. A vertical red line indicates the 1g stall speed (Vs1g). The colour of the plot line reflects the portion of the envelope that the plot point is in. Inset in the graph is a view of the current Angle of Attack.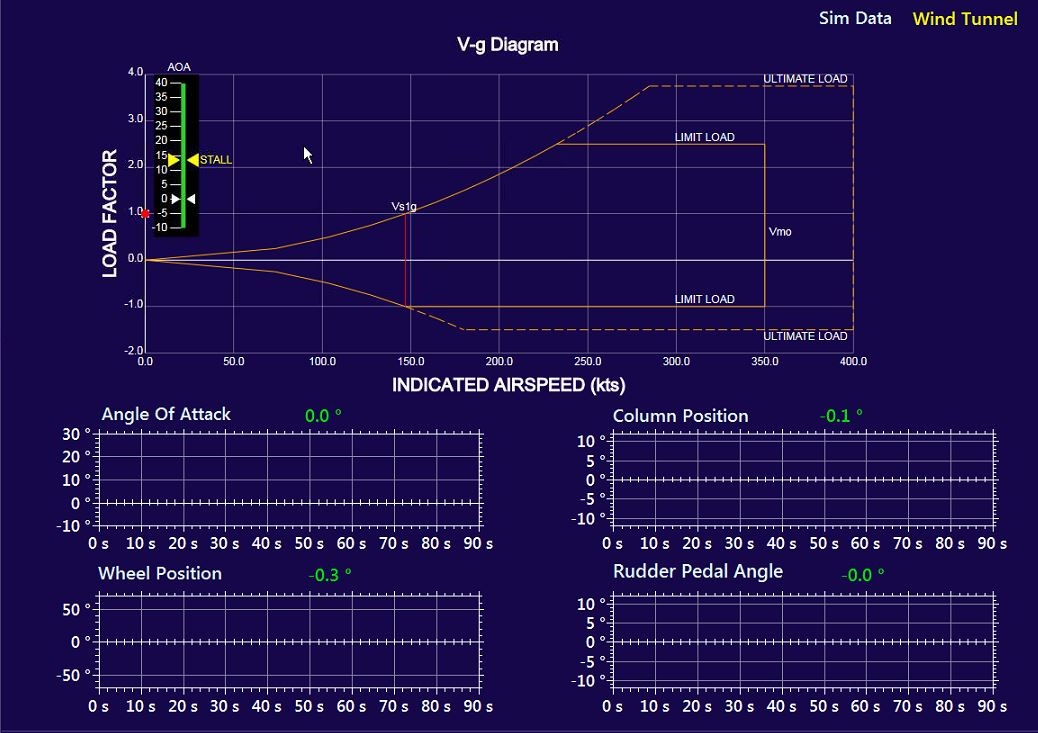 |
| Time History | A series of time history plots including Angle of Attack, Rudder Pedal Angle and flight controls related plots |
 |
Returns to the UPRT Index page |